
Quick Start Guide
Graphical User Interface Inputs
Elementary Rate Constants
1. kf: Forward binding of substrate to enzyme. E + S → ES
2. kb: Dissociation of ES complex to substrate and enzyme. ES → E + S
3. kcat: Product formation and release of intact enzyme. ES → E + P
4. kif: Binding of competitive inhibitor to the enzyme. E + I → EI
5. kib: Dissociation of EI complex to inhibitor and enzyme. EI → E + I
6. kiif: Binding of uncompetitive inhibitor to the enzyme-substrate complex. ES + I → ESI
7. kiib: Dissociation of ESI complex to inhibitor and enzyme. ESI → E + I
Notice: kf, kb and kcat roughly determine the Vmax and KM of an enzyme. A single compound may exhibit both types of inhibition simultaneously, giving rise to mixed and non-competitive inhibition.
8. System selection: Select from a menu of pre-loaded inputs for standard enzyme systems.
Reaction System Data
9. E0: (Molar) Enzyme: The maximum rate of reaction Vmax is directly proportional to E0.
10. S0: (Molar) Substrate: The rate of reaction v0 saturates at Vmax for large S0 values.
11. I0: (Molar) Inhibitor: When I0 ≠ 0 a reversible inhibitor changes the kinetics of product formation. Two basic types of reversible inhibition exist, competitive and uncompetitive.
12. Simulation time: (Minutes) Times longer than necessary to reach saturation are not recommended.
13. Assay time: (Minutes) This is the time at which the reaction is stopped prior to measuring the amount of product made, typically 10 to 15 minutes.
14. Reaction volume: (Liters) The total number of molecules depends on the volume and starting concentrations E0, S0 and I0. Reaction volume has no effect on the deterministic model. However, large reaction volumes slow down the stochastic model considerably.
15. Plot Controls: Check a box to see a plot of the corresponding chemical species on the plots panel.
Graphical User Interface Outputs
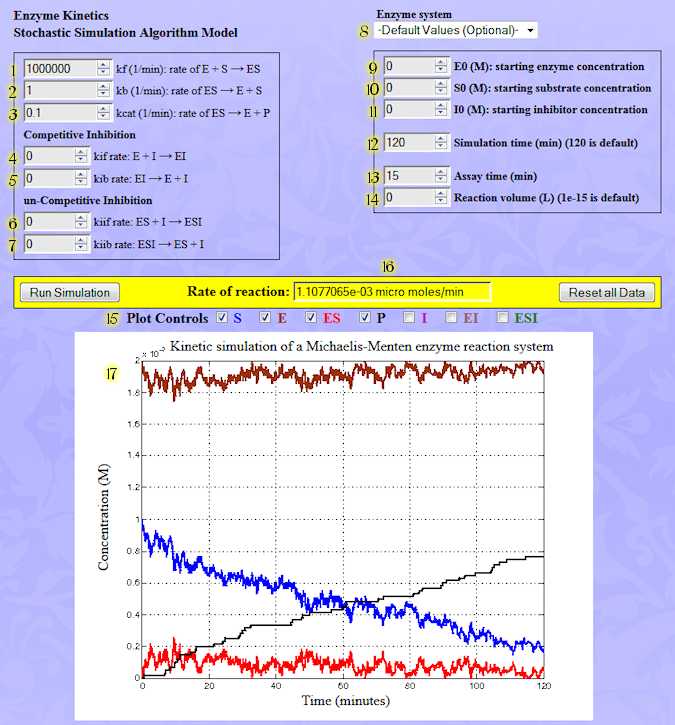
16. Rate of reaction: (μmol min-1) The average rate of reaction during the assay. It approximates the instantaneous rate of reaction at time t=0, v0.
17. Concentration vs Time plots: Concentration (Molar) versus time (Minutes) of all chemical species.
Graphical User Interface Operation
1. Select an enzyme system using the pull-down menu to load default inputs. If desired, the values inside text edit boxes can be changed by hand. To avoid execution and overflow errors it is recommended to start using default inputs.
2. Click the "Run Simulation" button. The simulation returns two types of results, a Rate of Reaction (inside the yellow box) and plots showing the time evolution of chemical species, such as substrate, enzyme product, inhibitor and complexes.
3. To add or remove plots from the plot panel check "Plot Controls" boxes, and click the Run Simulation button again.
 Start using the SimLab now.
![]()
S: Substrate. A molecule upon which an enzyme acts.
E: Enzyme. A chemical reaction catalyst.
ES: Enzyme/substrate complex. A chemical species formed by non-covalent binding of substrate to enzyme.
P: Product. A chemical species "manufactured" by an enzyme from its substrate.
I: Inhibitor. A chemical species that reduces the catalytic efficiency of an enzyme.
EI: Inhibitor/enzyme complex. A chemical species formed by non-covalent binding of inhibitor to enzyme.
ESI: Inhibitor/substrate/enzyme complex. A chemical species formed by non-covalent binding of inhibitor to the enzyme/substrate complex.
|