
Quick Start Guide
Graphical User Interface Inputs
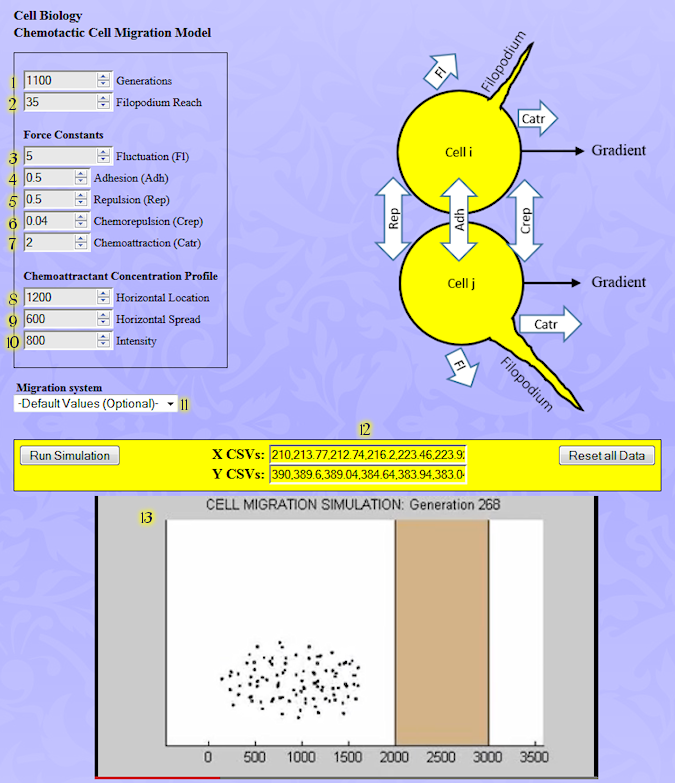
1. Generations: Number of simulation generations. Default = 100; Maximum = 2000.
2. Filopodium Reach: Average length of filopodium (filamentous cellular protrusion) Default = 10; Maximum = 5*R, where R is the cell radius.
Force Constants
Force vectors (see diagram) are applied at the location of the cell center. Their sum determines the net direction and extent of cell movement.
3. Fluctuation (Fl): Stochastic fluctuation force (circular Gaussian distribution).
4. Adhesion (Adh): Spring like adhesion force acting along the line segments that connect the central cell to each of its neighbors. It simulates the adhesion forces that are created when cells bind to together.
5. Repulsion (Rep): Spring like repulsion acting along the line segments that connect the central cell to each of its neighbors. It simulates the mechanical repulsion forces that appear when elastic cells are pushed against their neighbors.
6. Chemorepulsion (Crep): Repulsive force resulting from a cellular reaction to a chemical compound. Every cell emits a repulsive signal, which diffuses uniformly in every direction giving rise to a radially symmetric Gaussian concentration function.
7. Chemoattraction (Catr): Attractive force resulting from a cellular reaction to a chemical compound. The attractive signal is emitted from a block and it diffuses uniformly in the x-direction giving rise to an error function (cumulative Gaussian) concentration.
Notice: Cells cast filopodia in every direction at random and the chemoattraction force is proportional to the dot-product of the concentration gradient and a vector directed along the filopodium.
Chemoattractant Concentration Profile
8. Horizontal Location: The point of maximum slope in the concentration function.
9. Horizontal Spread: Spread of the Gaussian error function.
10. Intensity: Maximum chemoattractant concentration within the region marked by a tan box in the movie.
11. System selection: Select from a menu of pre-loaded inputs for standard enzyme systems.
Graphical User Interface Outputs
12. X CSVs, Y CSVs: Use to display comma-separated text data for x and y cell coordinates at different generations in a new browser window. To save the data hit ctrl-A (select all) and ctrl-C to copy, then insert into an ASCII text editor window such as Notepad or Wordpad. Use the suffix .csv so the data can be read automatically into an Excel spreadsheet.
13. Movie Pane: A compressed movie representing all the input data.
Graphical User Interface Operation
1. Select an enzyme system using the pull-down menu to load default inputs. If desired, the values inside text edit boxes can be changed by hand. To avoid execution and overflow errors it is recommended to start using default inputs.
2. Click the "Run Simulation" button. The simulation returns two types of results, a Rate of Reaction (inside the yellow box) and plots showing the time evolution of chemical species, such as substrate, enzyme product, inhibitor and complexes.
3. To add or remove plots from the plot panel check "Plot Controls" boxes, and click the Run Simulation button again.
 Start using the SimLab now.
|